 Skip to content
 Over the last year, I’ve had more downtime than I prefer. That doesn’t mean I haven’t found ways to fill the extra time though. I learned in college that the busier I am the more I get accomplished so I like to stay busy. When I’m not consulting, I look for personal and professional development opportunities.
As you’ve seen from previous posts, reading is one my favorite development activities. In 2013, I read 37 non-fiction books. However, there were many other options: webcasts, podcasts, class/lectures, conferences, volunteer work, and networking to name a few. I also believe that you have to have some fun as well. Those activities included museums, concerts, films, theater, and cultural events. Each of these activities offered learning opportunities.
As I was meeting with a potential client, I was asked about how I spent my time outside of consulting and while I was able to share some of my development activities; it seemed to fall a bit flat. I wondered if they thought it was just fluff. So I wondered, “How can I share this information in a way that reinforces my work ethic?”
I decided to create an infographic. An infographic is “a visual image such as a chart or diagram used to represent information or data.”1 Using an infographic allowed me to demonstrate that I recognized the importance of two current trends: visual presentation and analytics. Instagram, Twitter, SnapChat, etc, have embraced and moved toward visual content as a way to enhance communications and interactions. For example with Twitter, tweets including with images receive 89% more favorites, 18% more clicks, and 150% more retweets.2 Analytics is also a hot topic as companies learn that data can help them make better decisions and spot trends. One example of analytics and big data is Target. Check out this article to learn more: “How Target Figured Out A Teen Girl Was Pregnant Before Her Father Did.”3
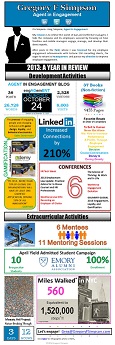
I collected data on my development and extracurricular activities. Make a list of all your activities and I think you might be amazed at the data you can compile. For instance, I included data on this blog: number of posts, word count, number of page visits, number of visitors, and the date the site launched. I did the same for the books I read, the conferences I attended, the webcasts I watched, even down to the number of miles I walked in 2013. The more information you accumulate, the more options you’ll have as you determine what to include in your infographic.
Through Hubspot, I found 5 free infographic templates for PowerPoint. While there are sites that will create infographics for you (visual.ly, piktochart, and infogr.am), none quite met my needs. With a little creativity…and time…I finally assembled my first infographic! I ended up not using the template layouts (why make it easy on myself, right?) but did utilize the page setup information. Remember, you can be as creative as you want!
And here is the final product: Gregory F Simpson 2013: A Year In Review
I’m excited to have an interesting way to present what I accomplished in 2013. If we apply this to employee engagement, think about how using an infographic in a performance review could help deepen the conversation and demonstrate the value you bring to your role, department, and company. What about using an infographic as part of your team or department onboarding experience? What about using an infographic to help you customers better understand the service you deliver? There are many applications and I encourage you to give it a try.
What do you think about using an infographic to tell your story? What other tips can you share on ways to leverage infographics?
1 “infographic.” OxfordDictionaries.com. Oxford, 2014. Web. 26 Feb. 2014.
2 Cooper, Belle Beth. “How Twitter’s new expanded images increase clicks, retweets and favorites [New data].” Buffer. 13 Nov. 2013. Web. 26 Feb. 2014.
3 Hill, Kashmir. “How Target Figured Out A Teen Girl Was Pregnant Before Her Father Did.” Forbes. Feb. 16 2012. Online and Print.
P.S. – First time here? Welcome to the Agent In Engagement site. Thanks for taking the time to stop by! I hope you’ll explore the rest of the site. Let me know what employee engagement topics interest you.
If you enjoyed this article, you may also like…
- Employee Engagement Recap for Week of February 17 – 21, 2014
- Employee Engagement Quotes from February 10 – 14, 2014
- Just Say Hello!
- Employee Engagement Recap for Week of February 10 – 14, 2014
- Employee Engagement Quotes from February 3 – 7, 2014
- Naches and Employee Engagement
Let’s Get Engaged!
I’m Agent in Engagement Simpson…Gregory Simpson.
As an Agent in Engagement, my mission is to relieve the world of bad and ineffective managers. I help companies and their employees succeed by focusing on how frontline and middle managers engage, manage, and develop their direct reports.
After years in the field, the consulting field, where I was honored for my employee engagement achievements with Fortune 150 clients, I’m looking forward to returning to headquarters where I’ll continue to pursue my directive to improve employee engagement.
I’m excited about this opportunity to connect with fellow “Agents.” Subscribe to the RSS Feed to receive the latest updates and/or register to comment on posts.
You can follow me @agtinengagement, email me at g…@a…t.com or learn more about me at www.gregoryfsimpson.com.
